As discussed in our previous article, Price Pattern Basics – Triangle Formations, price patterns have been studied by traders to help forecast the markets next move. This article will focus on reversal patterns. A few of the most common reversal patterns include head and shoulder patterns, double tops, and double bottoms.
Double tops are one of the easiest patterns to recognize. These formations occur when the market is in a bull trend. The first top is made when a market makes a run higher and fails at a resistance level. Selling pressure takes over and the market falls lower. Bulls see this selloff as a buying opportunity and the market is sent higher to re-test resistance. The second top is created when the market fails at the same level of resistance and is followed by extreme selling pressure. This indicates that traders view the market as overbought at this price level and leaves the bears in control. This process can continue, creating triple or even quadruple tops before the reversal takes place.
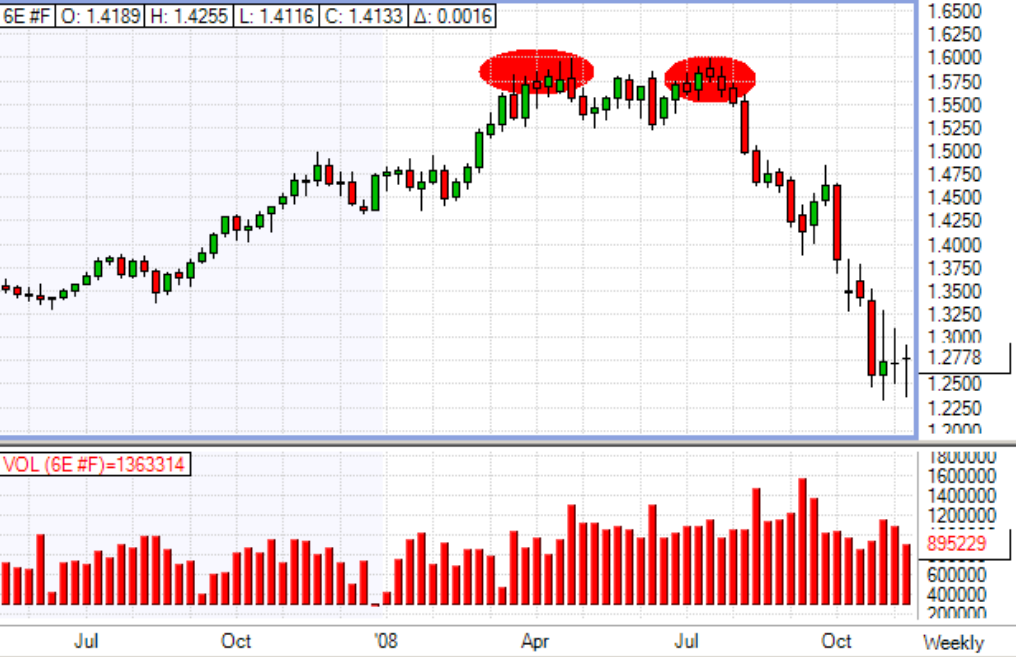
Below is a chart of the Euro FX. As you can see the Euro made a nice run up to 1.60 before failing at resistance. The market then sold off and consolidated for some time before re-testing the 1.60 resistance level. Again, the euro failed. Heavy volume followed the failure to break the $1.60 level and the Euro traded all the way down to $1.25.
Any trades are educational examples only. They do not include commissions and fees.

Euro FX Chart
Double top formations will leave traders with two possible signals. Aggressive traders will look for a short entry when the second attempt to break resistance fails. More conservative traders will wait until the market closes below its support level. A close below support will provide the short signal.
The reverse of a double top is a double bottom formation. This is a reversal pattern that occurs when a bearish markets turns into a bullish market. The market will test support, fail, and rally higher. Sellers will jump in the market to re-test support, but the selling pressure is not enough to break the support line. This failed attempt is followed by strong buying that sends the market through resistance.
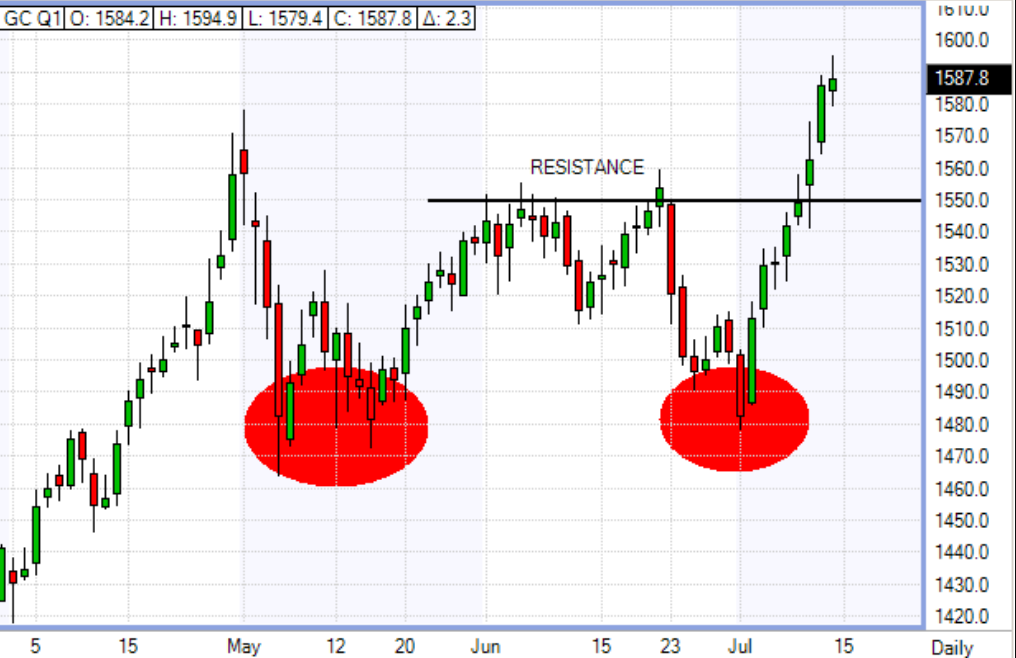
Below is a chart for gold. The first week of May, gold sold off from its rally and found support around the 1480 level. We bounced around 1480 for the next few sessions before rallying higher. This test of support created the first bottom. Over the next month and a half, gold managed to rally $70 before re-testing support at the 1480 level. Once again, gold bounced off of the 1480 support line and soared higher. This second test of support is what creates the double bottom.
Any trades are educational examples only. They do not include commissions and fees.

Gold Chart – Double Bottom
Aggressive traders could buy gold as soon as they see support hold at 1480. More conservative traders will wait for gold to close above resistance before going long.
The next pattern we will discuss will be the head and shoulders pattern. This strategy is often considered one of the more reliable reversal patterns. Head and shoulder patterns signal an end of an uptrend and a reversal to follow.
A head and shoulder pattern occurs in an uptrend where a market makes a new high before failing at a resistance level. Selling pressure takes over and the market falls lower. This pull back is followed by a rally through resistance, creating the left shoulder. The market continues to spike higher on the breakout until a new high is reached. This spike is met by aggressive selling and the market sells back off. The spike to the new high followed by the aggressive selloff is what creates the “head” in the head and shoulders pattern. The market tries to test the previous high but fails, creating a lower high. This attempt and failure to reach new highs is what creates the right shoulder.
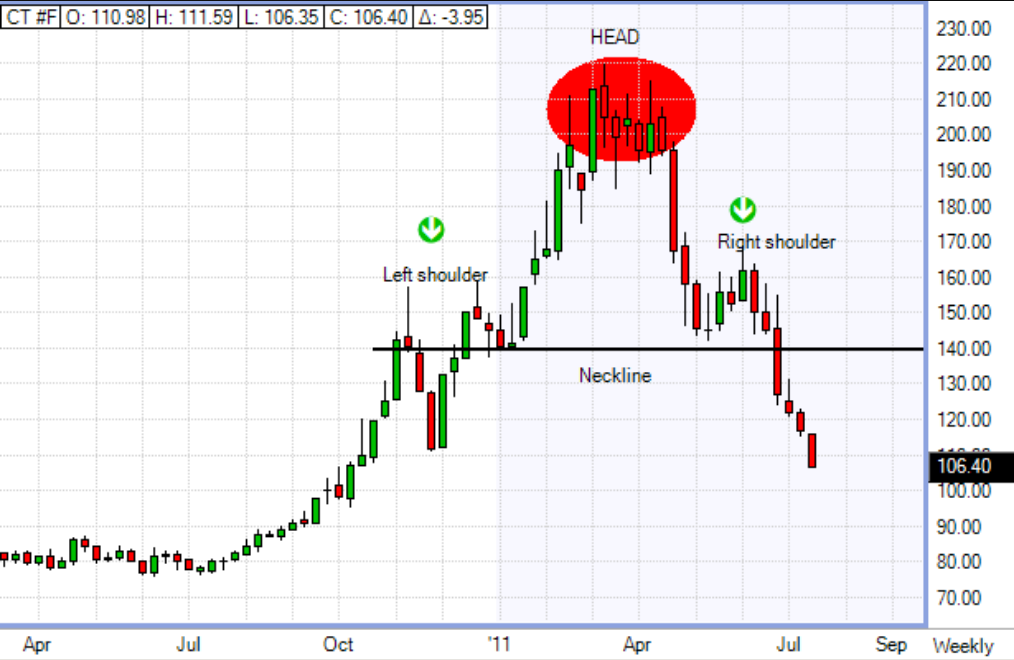
Below is an example of a head and shoulders pattern in cotton. Cotton makes an impressive run higher from October to December before it finds resistance at the 160.00 level. Cotton fails at 160.00 and sells off to around 110.00. Buying interest picks up and the market breaks through the 160.00 resistance and makes a new high at 220.00. This spike higher is followed by strong selling, and cotton pulls back below 160.00. It consolidates for a few sessions and then tries to make another run through 160.00, but fails. The rejection at the 160.00 level sends the market radically lower. The 160.00 support/resistance level is what creates the shoulders in the pattern, and the spike to 220.00 is what creates the head in the pattern.
Any trades are educational examples only. They do not include commissions and fees.

Cotton Chart – Head and Shoulders Pattern
Traders view these formations as an opportunity to short the market. A close below the neckline will signal a short entry.
A head and shoulder bottom or an inverse head and shoulder pattern is the exact opposite of the head and shoulder top. The inverse head and shoulders pattern is a bullish reversal pattern. The market sells off to a support level and fails, creating the left shoulder. The market then breaks support and sells off to a new low, creating the head. Buying picks up and the market heads higher. Sellers make one more attempt at the previous low but are unsuccessful, creating the right shoulder.
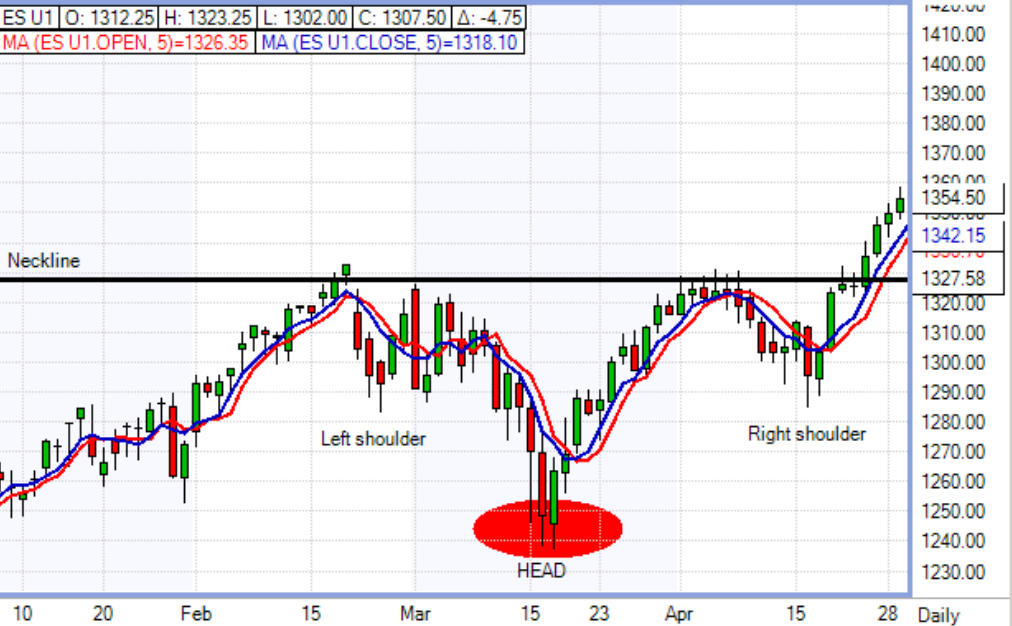
Below is a chart of the e-mini S&P. The S&P sells off to 1290 before buying picks up. The market rallies back above 1320 before selling pressure kicks in. The S&P sells back off to a new low of 1230. High volume buying follows, pushing the market back to 1320. The S&P makes one more attempt at the 1230 low, but fails. The market pushes through the neckline resistance level and continues higher.
Any trades are educational examples only. They do not include commissions and fees.

E-Mini S&P Chart
Traders will look for a break above the neckline to signal the buy entry. A close above the neckline concludes the head and shoulders pattern and confirms the market reversal.
Once again, unexpected news and events can easily alter these patterns; however, technical traders will consider these formations when analyzing the market.


You must be logged in to post a comment.